

Technology we're using to map our woodland
Technology we're using to map our woodland
I’ll be honest with you, I was trying to get away from technology. However I am not a luddite so when a task calls for a tool, I use the tool and get over myself.

As I’ve been furthering my work on the woodland management plan and generally cracking on with college work, I’ve come to realise that there is one technology that is used a lot in treeworld and that’s Geographic Information Systems (GIS).
What is GIS?
GIS (gee-eye-ess or “jis” ) in itself is a broad term. It may be used to refer to specific software such as QGIS , ArcGIS💰 and PostGIS. However GIS may also be used to refer to a generic approach such as “we used GIS to quickly capture the layout of the site”. What I’m trying to get at here is that GIS means something quite specific in terms of system and process (you are 100% modelling the geometry of earth in someway), but is quite vague in terms of tool and procedure (you may be using one of a million tools and infinite workflows to do so ). You may also hear the term ‘geospatial’ bandied about, especially if you’re from a web background. Geospatial is the cool kid way of referring to the data used in GIS workflows. For example, “we captured the geospatial data by crowd sourcing, and then we brought it into a GIS workflow for which we used QGIS”. Notice how easily the technobabble rolls off the tongue?
Despite a number of years working in technology (specifically python and Django), GIS is one area that I hadn’t really explored in much depth. It wasn’t long after we got the woodland that I knew that GIS would be something I’d have to brush up on and use. I’d always evaded using the GIS stuff in my web work. I always had zero fun convincing the software libraries to install in various places and the intellectual overhead always zapped me. However, now there is no avoiding it, hence this post.
QGIS
My first usage of GIS in practice was in my first synoptic assessment period (March 2023) at college. Part of the task was to produce a sample report for eight trees. We were under no obligation to use GIS, but I like to push the boundaries of my skills and so I downloaded and installed QGIS. Below you can see what I made.
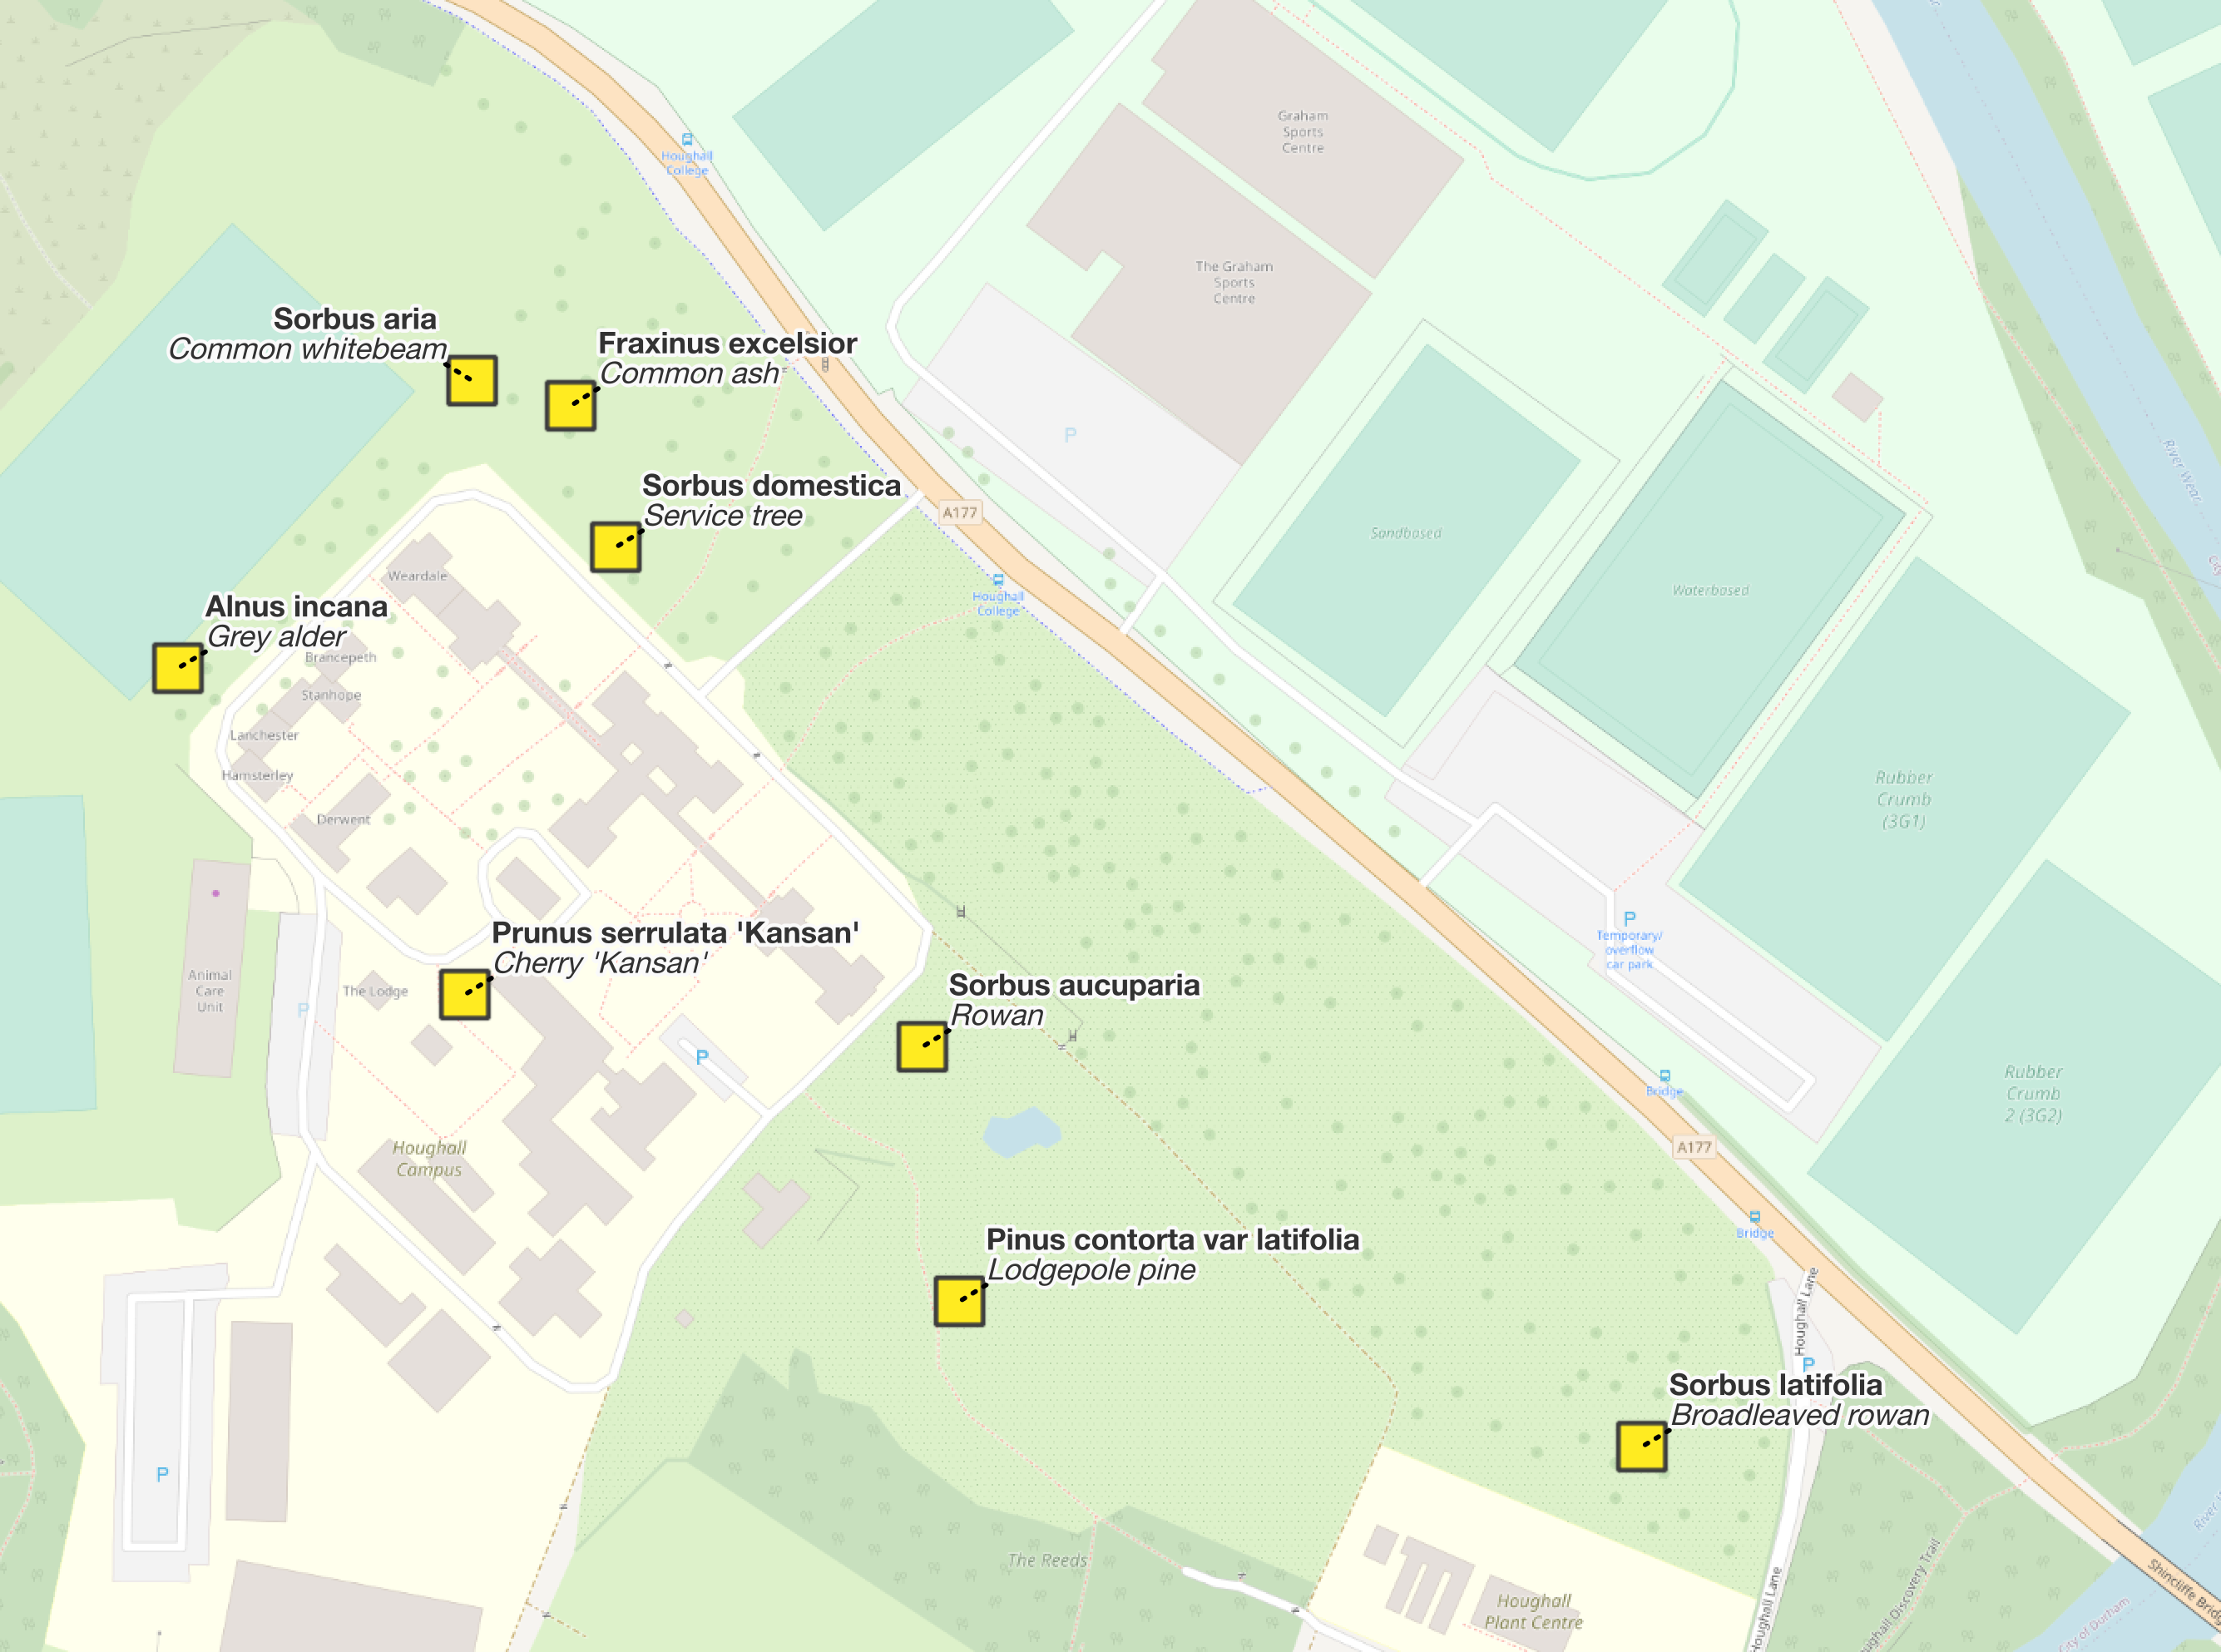
Arguably, I could have made this map with any one of a thousand graphic packages. The benefit of using something like QGIS however is that it is actually a map. I can zoom out quickly without having to re-draw the map. Behold…
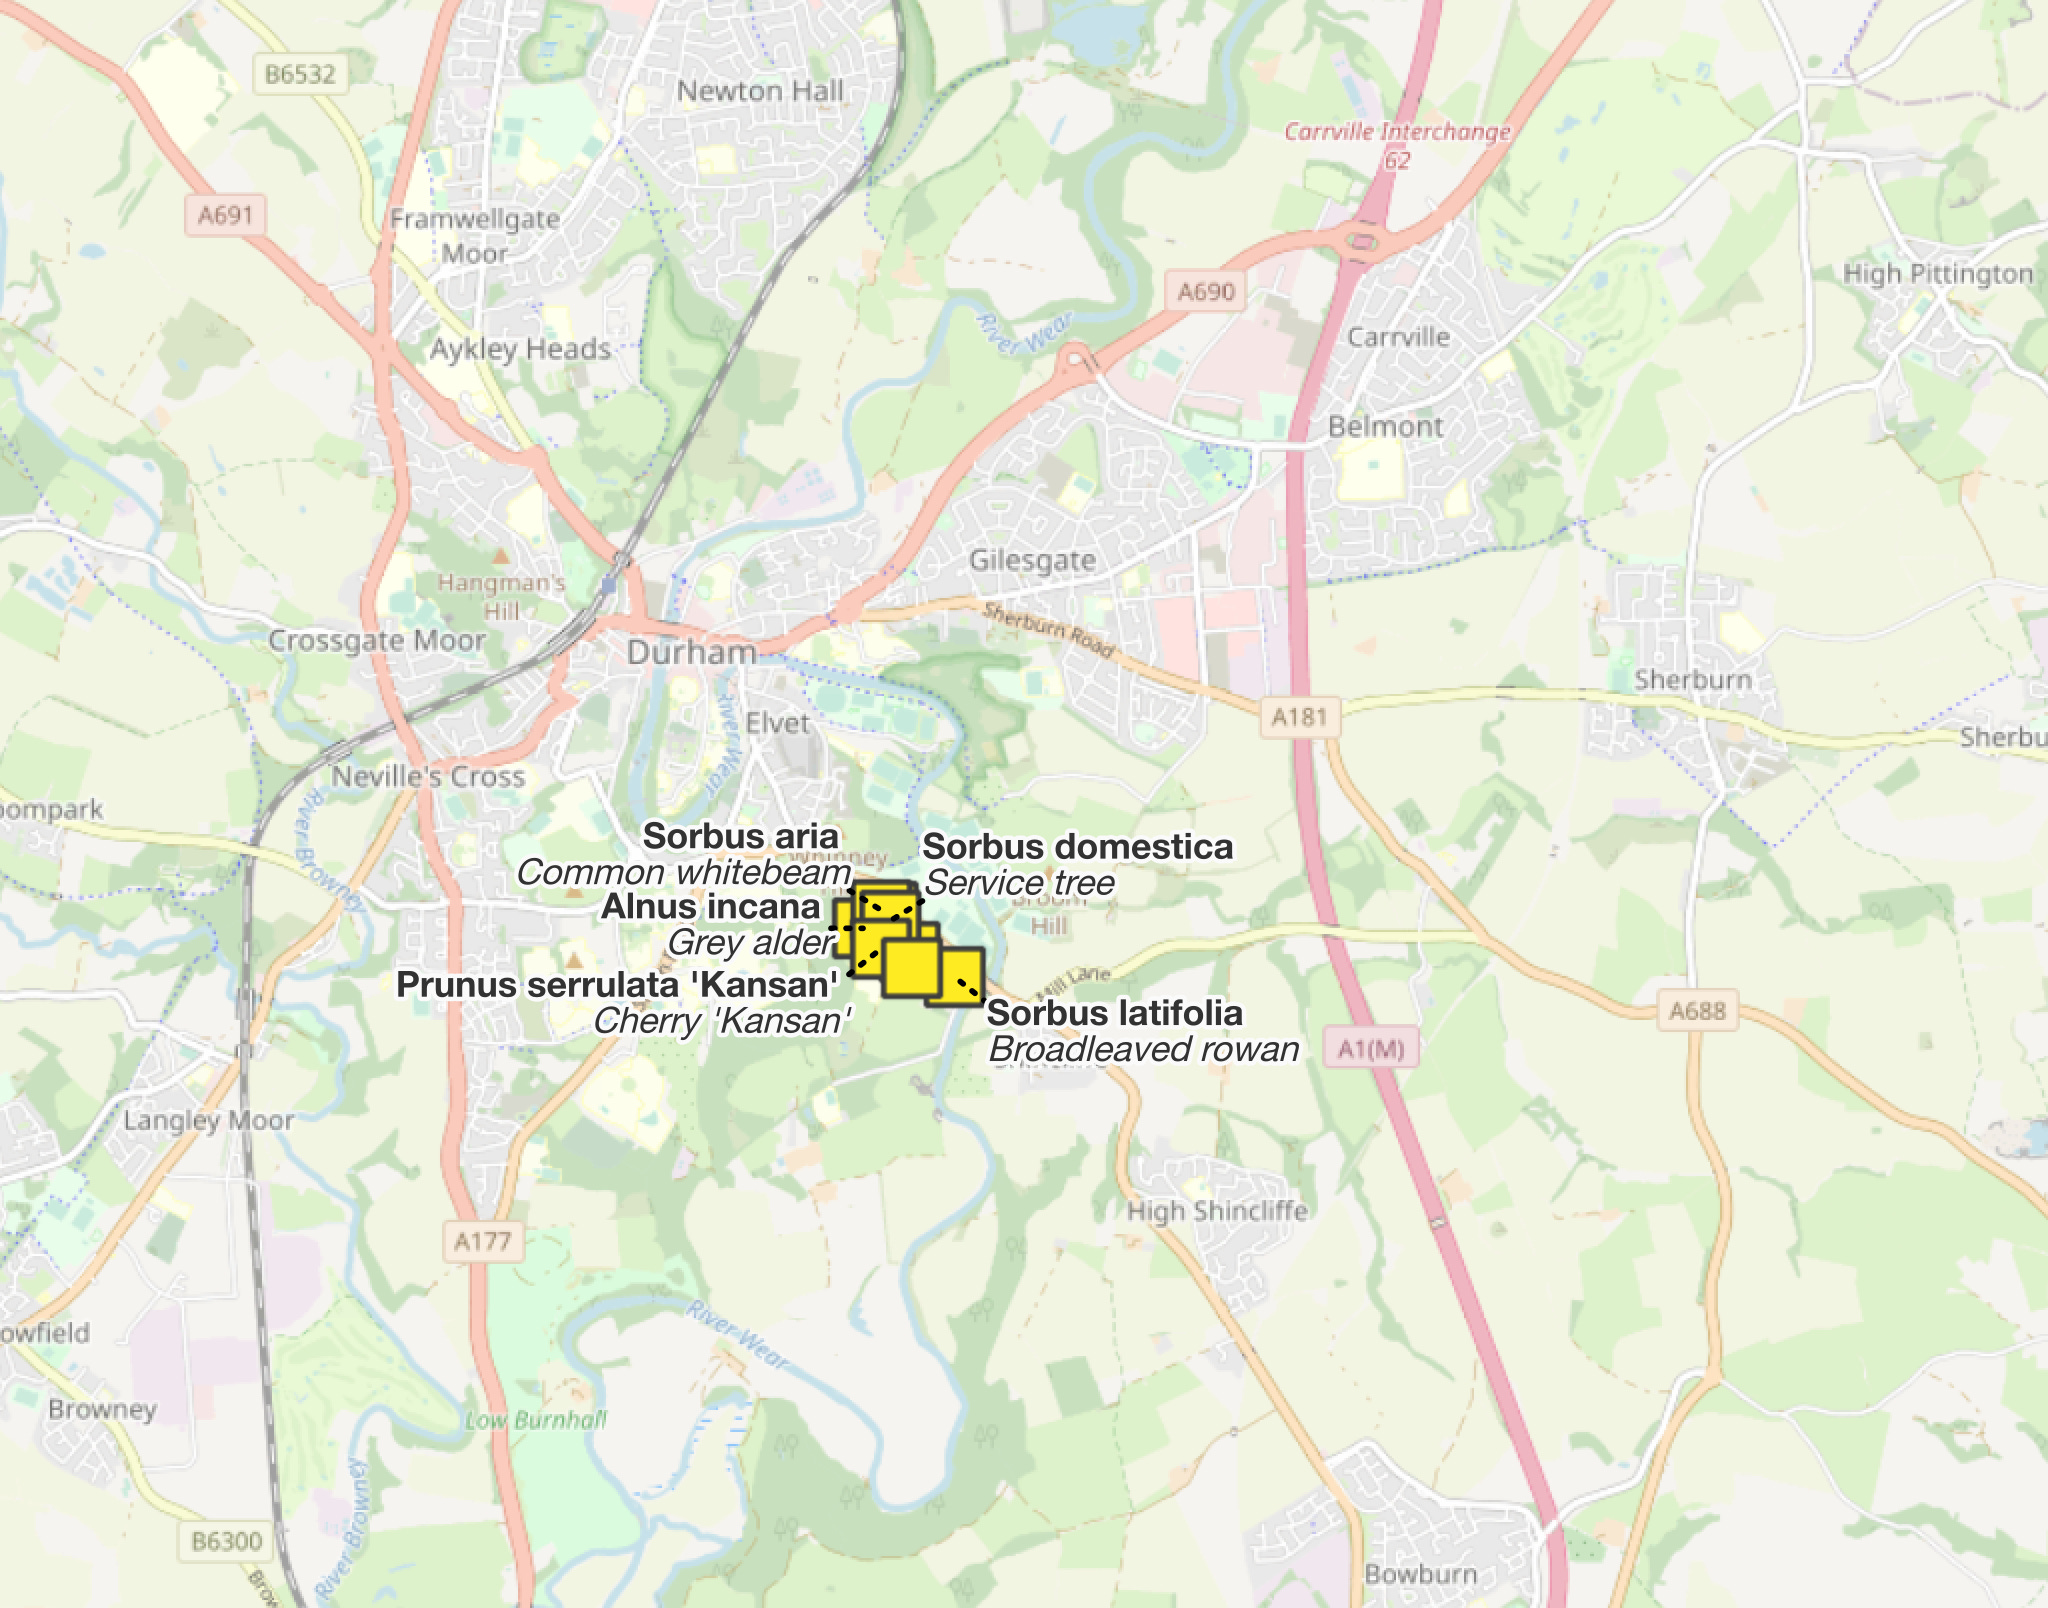
If I was using a graphics package to make this map and then found out I had to re-size the map, let’s just say I’d be a very-sweary-and-not-happy-camper. But with QGIS you’re working with a map at all times so zooming in and out is not only easy, but is also kind of the point.
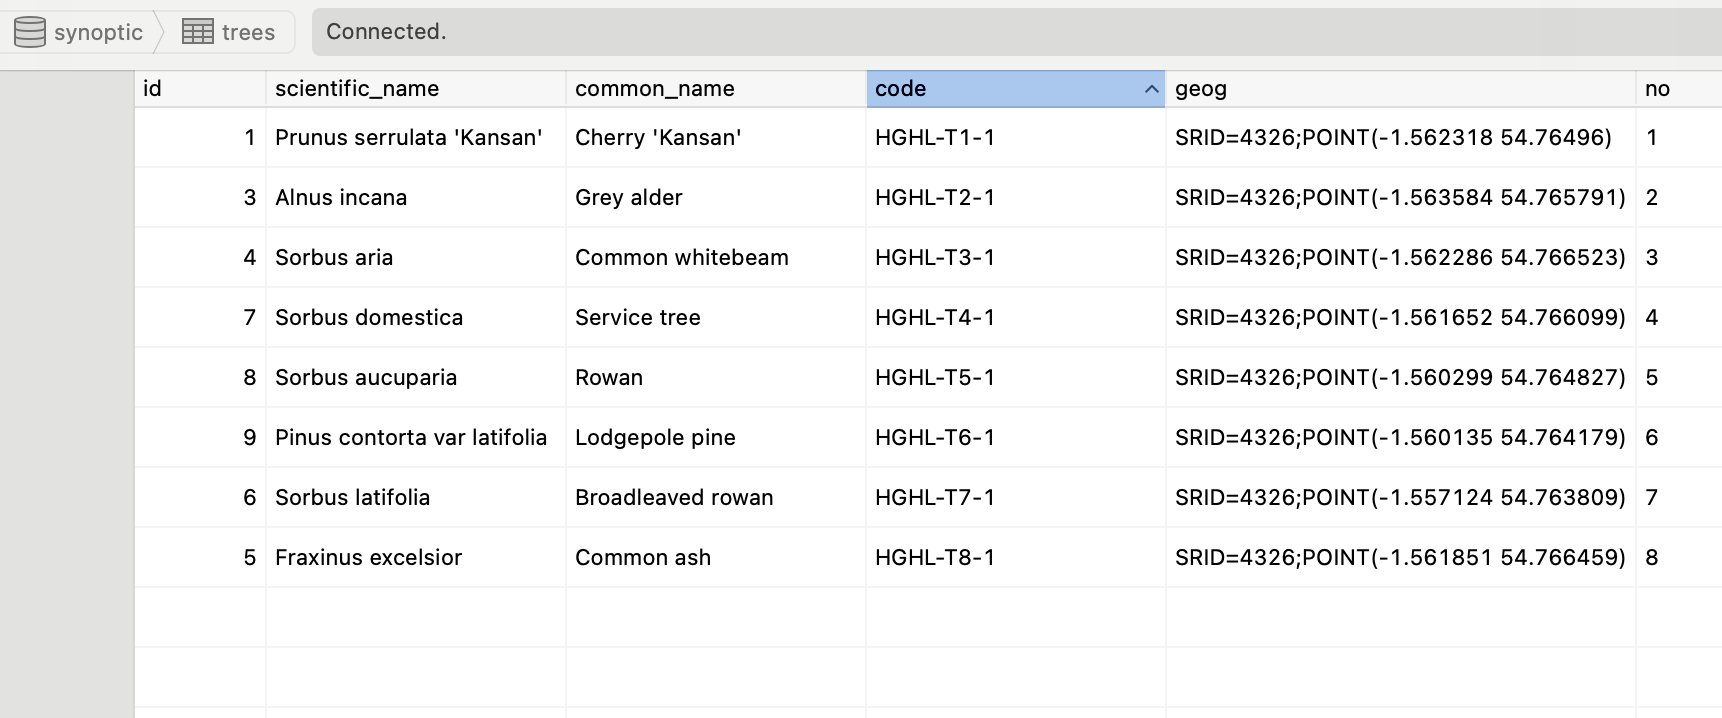
I don’t know QGIS very well at this point. I basically hit it with a hammer and poked it with a stick to get the above map. However, I know enough to be confident to state that it has a concept of layers that are always bound to some flavour of Cartesian co-ordinates. Hence, when you scale the layers, all of the points / shapes / curves move in relationship to each other. In the examples above I am using two layers. One is Open Streetmap for the underlying mapping. The other is point data that is coming from a Postgres database using the PostGIS libraries. It isn’t that exciting to look at, but here’s a screenshot of the data.
I also know that QGIS has first class support for python, which is nice as I have a lot of years of python programming under my belt. I look forward to exploring that and to deeply understanding the capability of QGIS.
It’d be worth stating quickly that QGIS and ArcGIS are both tools designed to do the same thing generally speaking. However QGIS is open source (and is free as in beer and speech) and ArcGIS is proprietary and thus requires varying amounts of gold to purchase a license to use it. For now, I’ll be investing my time learning QGIS and investing my gold in myself.
MyForest
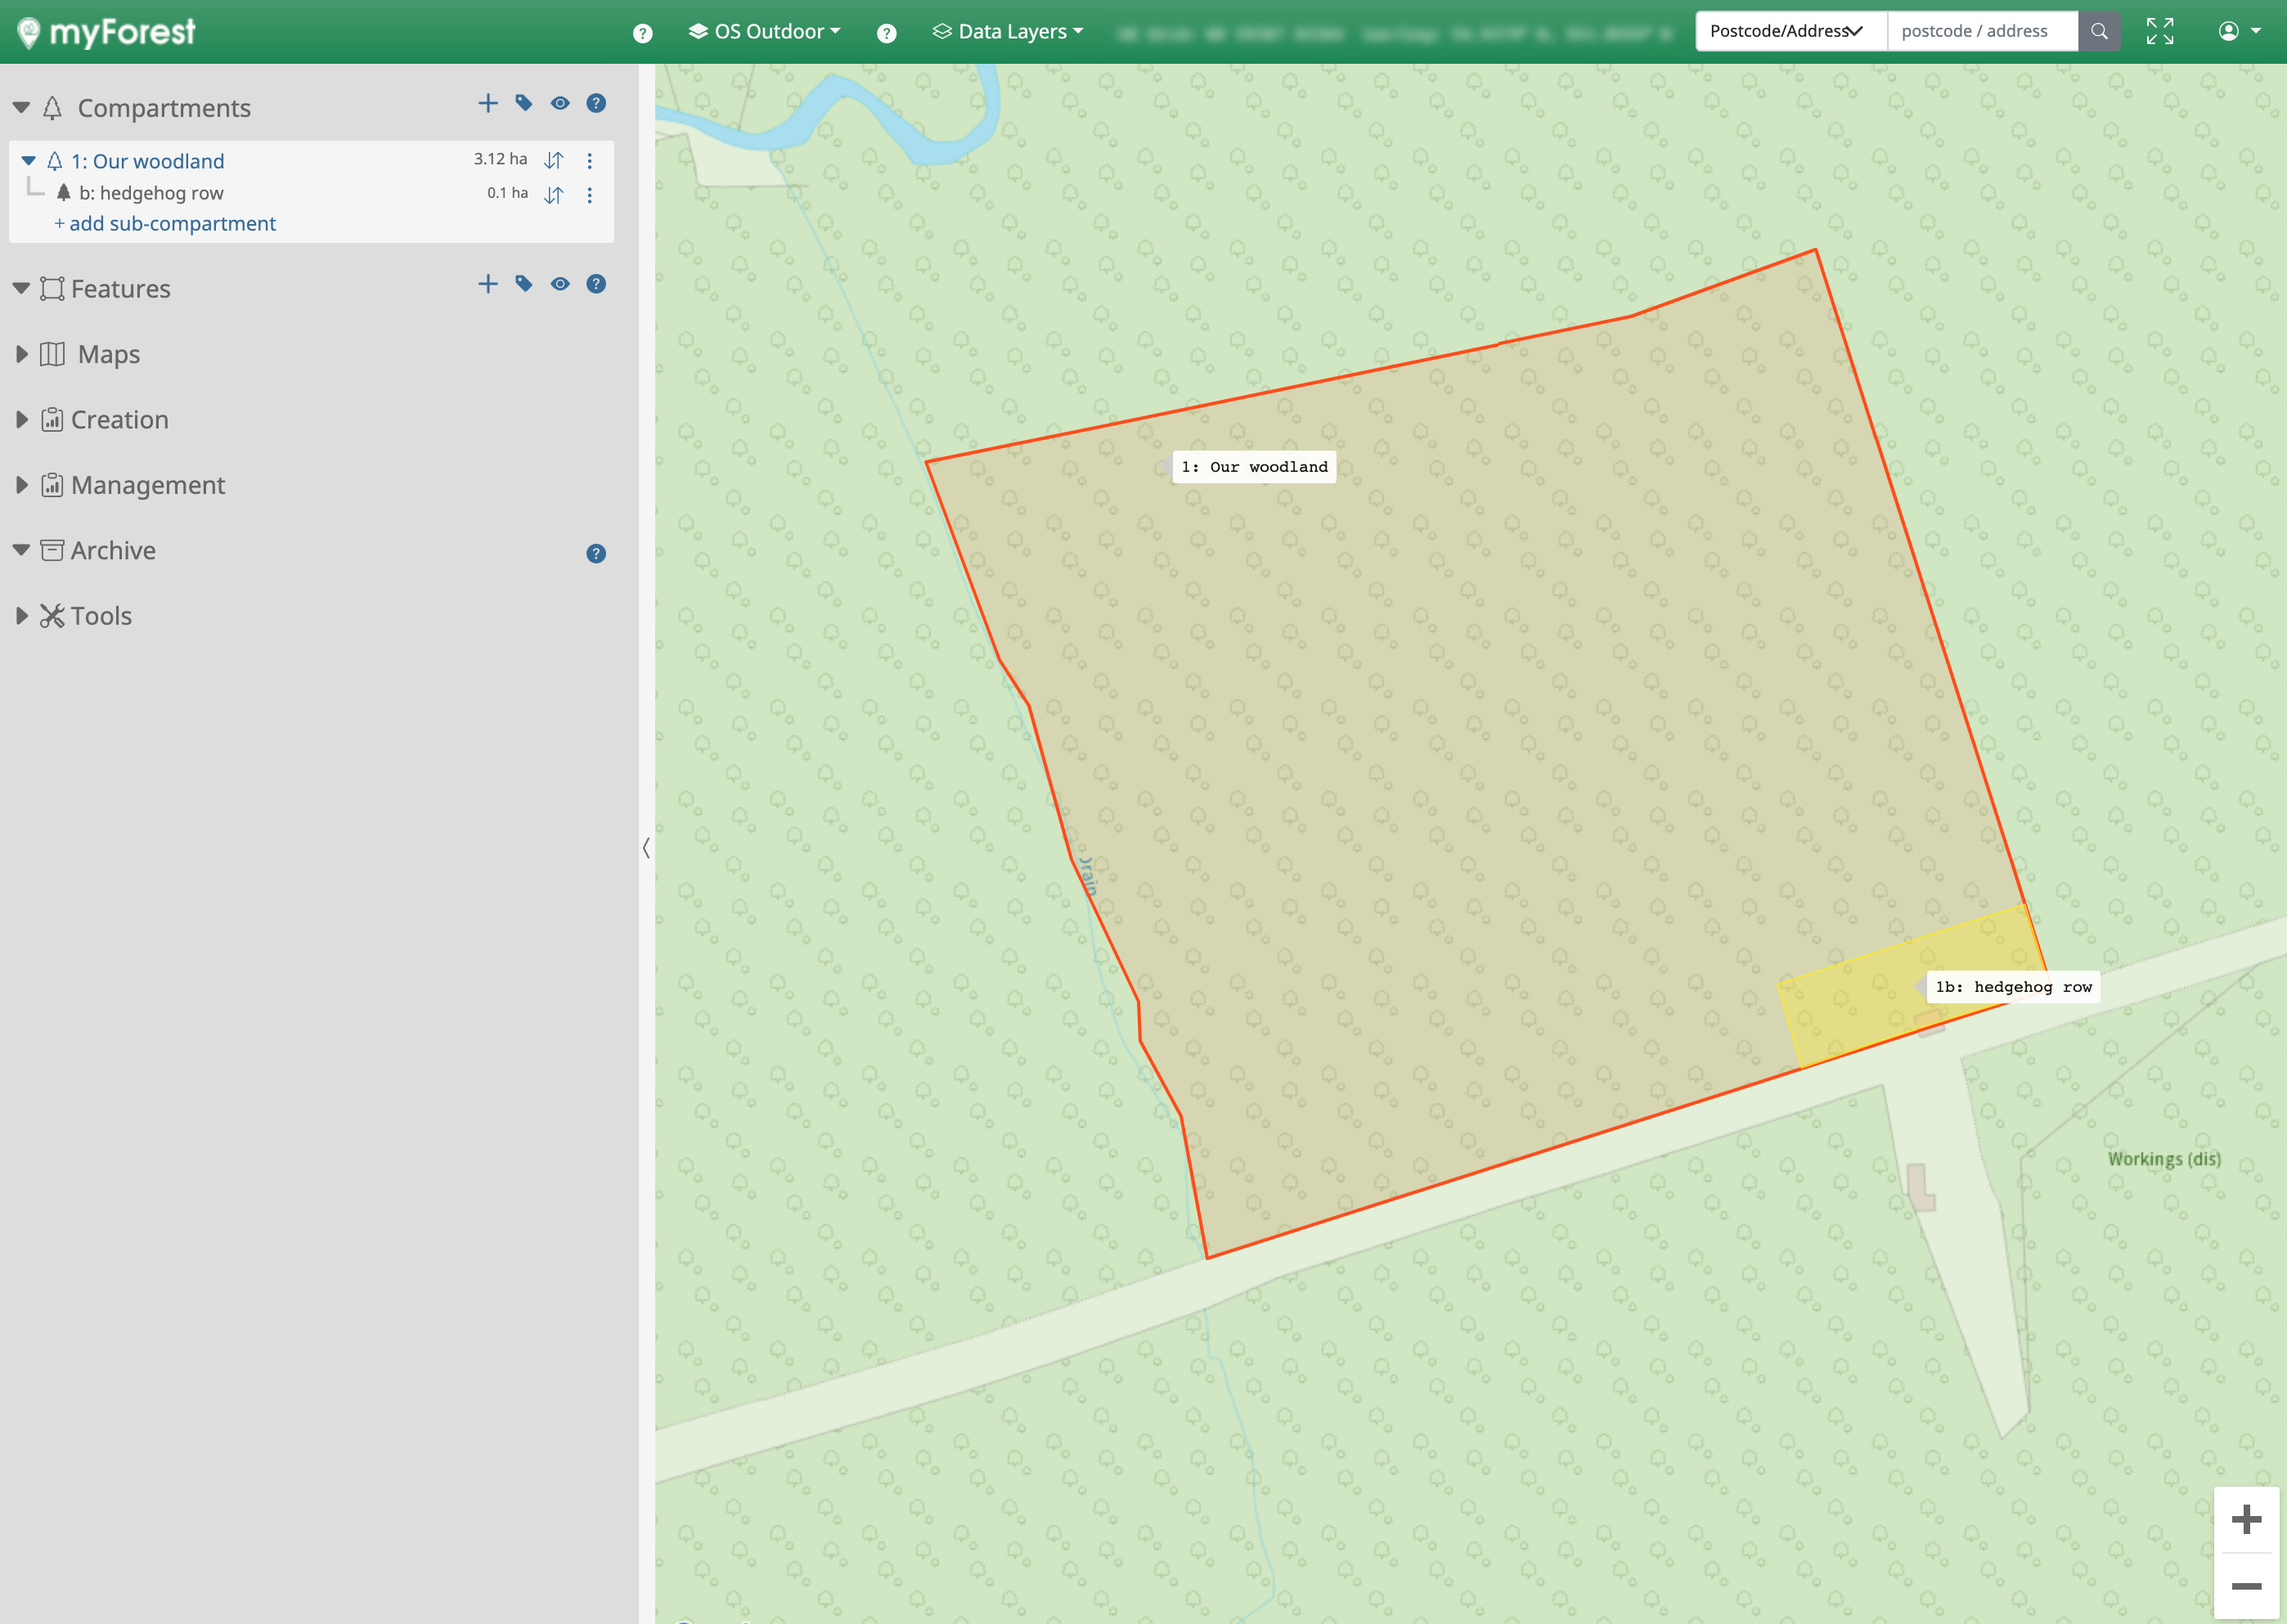
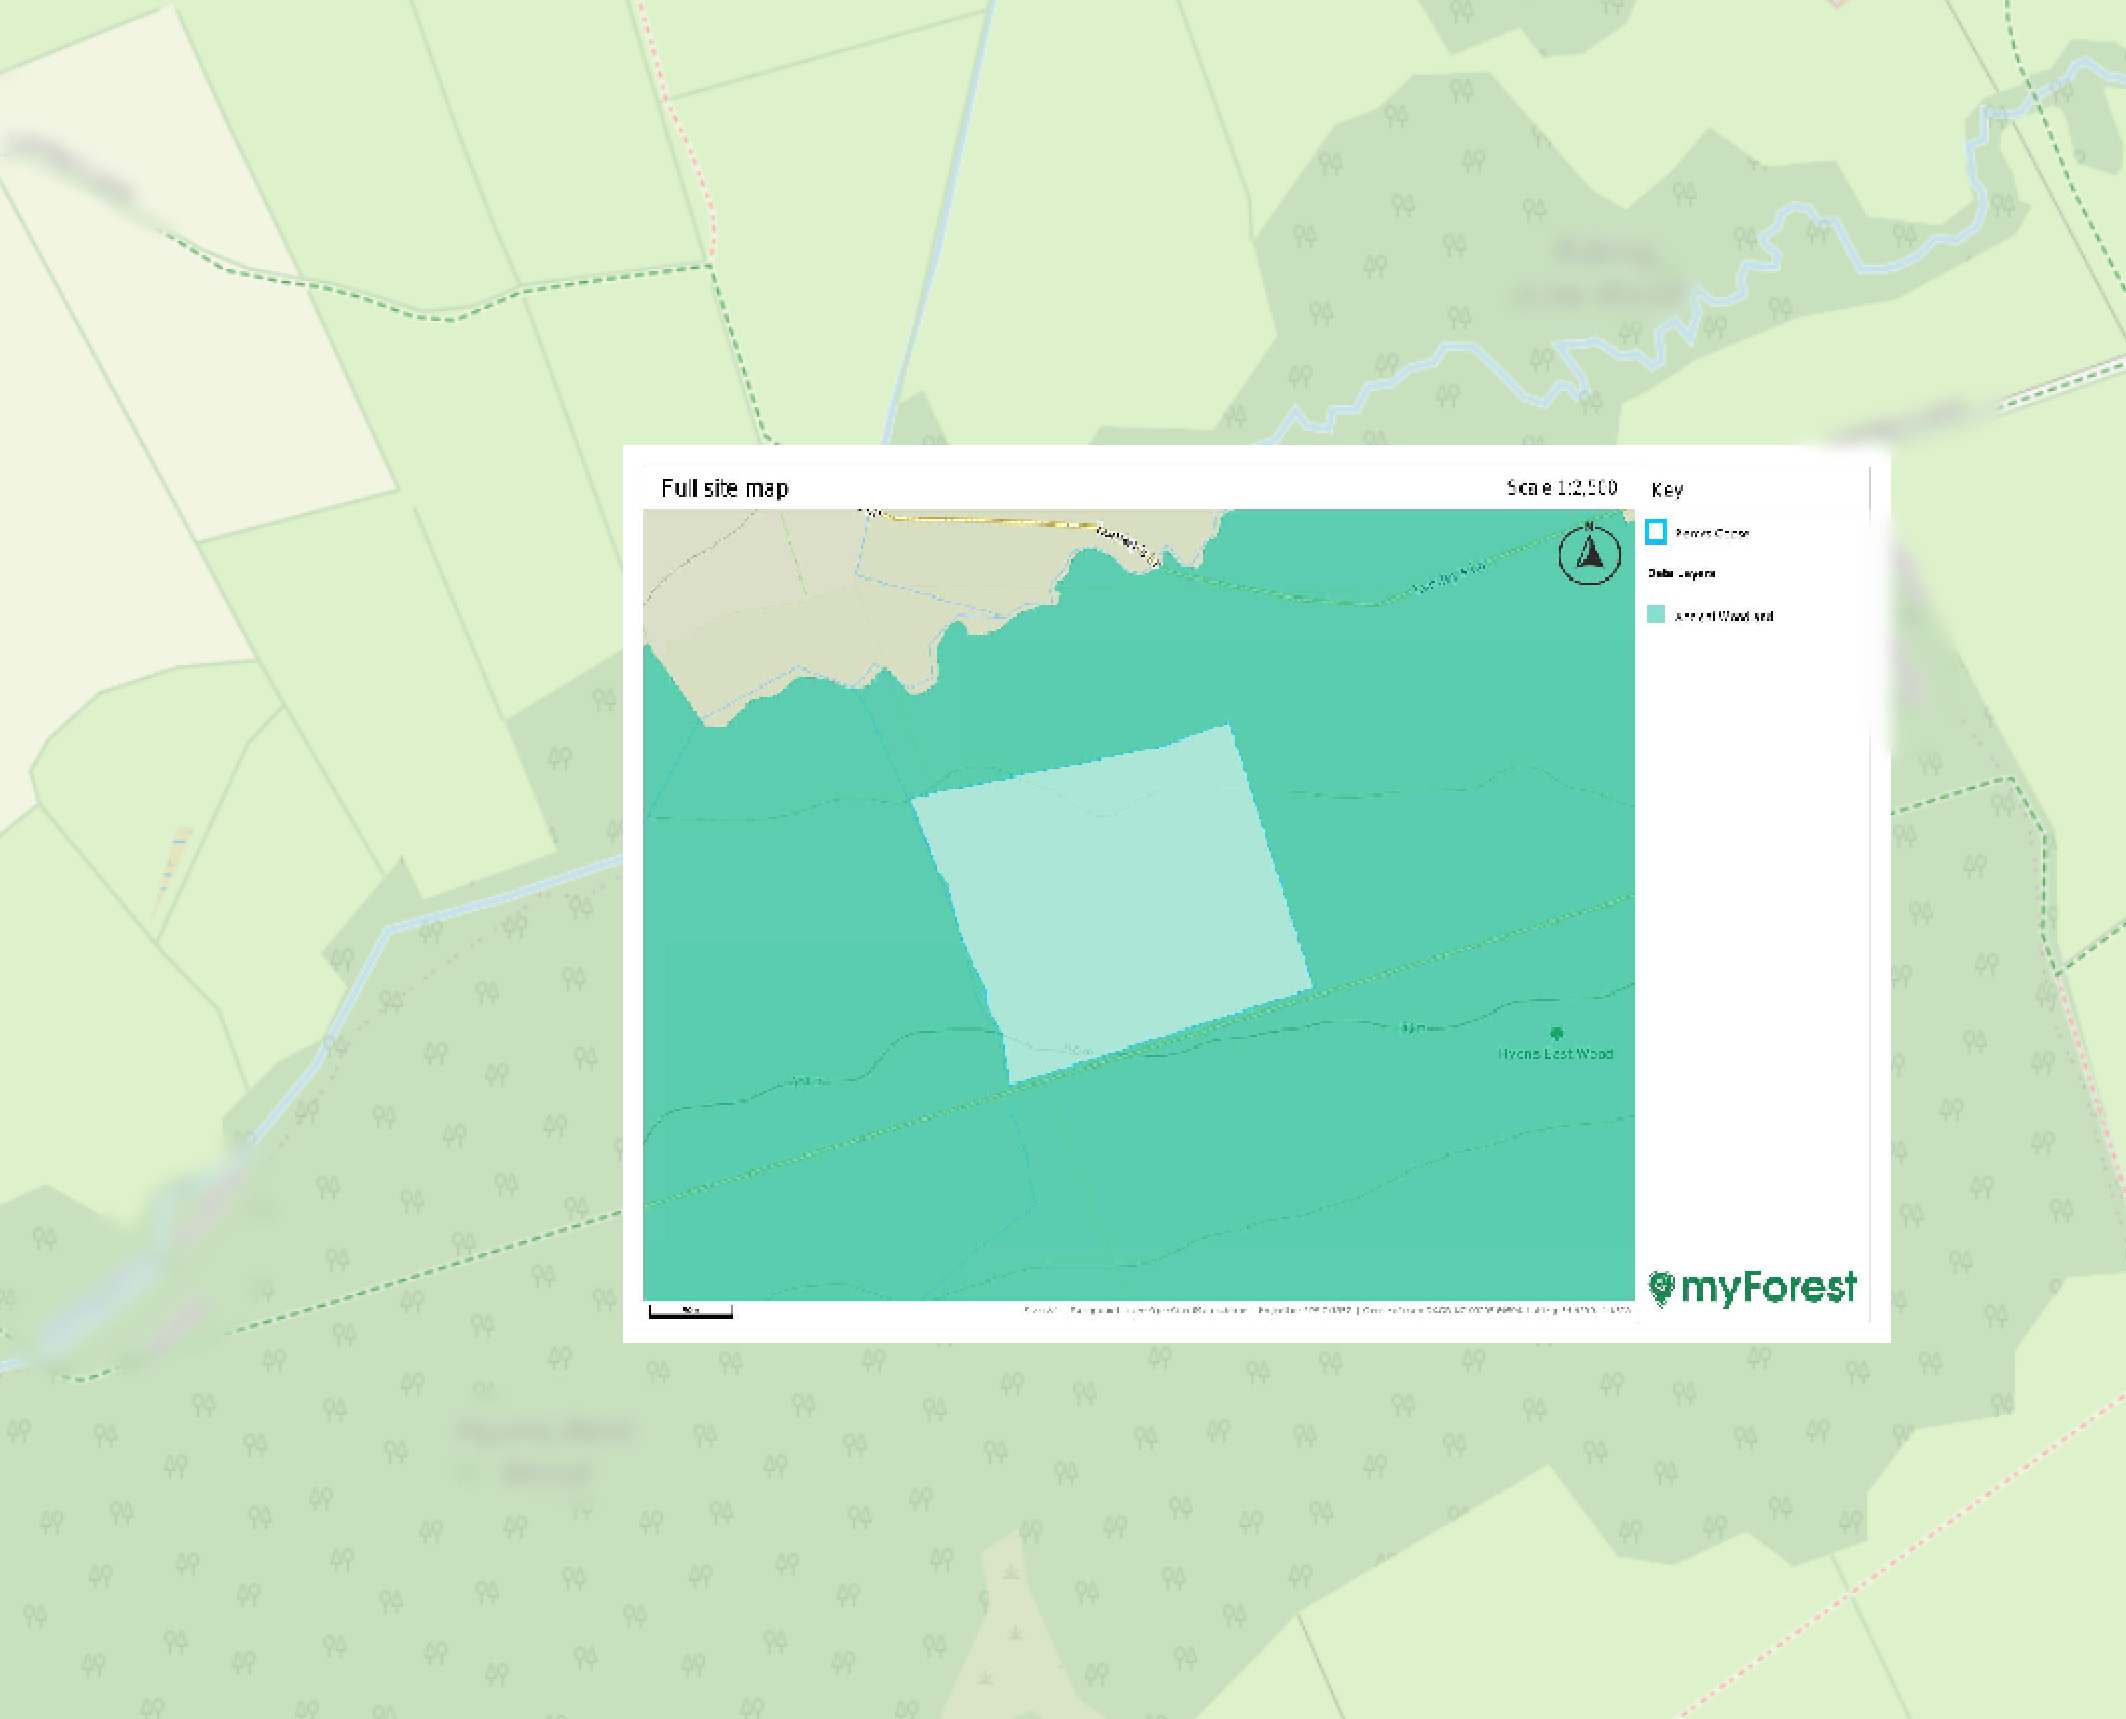
MyForest is a web based GIS product designed especially for woodland management. It makes the process of generating Forestry Commission compatible management plans obscenely easy. The MyForest product is made by the Sylva foundation and they offer free and paid plans. I started off with a free plan and it was enough to get me going. Through a twist of fate I ended up entering a competition they were running and I ended up winning a years subscription to their “forest owner” plan which costs an exceptionally reasonable £24 a year1. Below is a screenshot of the tool in use. Here you can see the map of our woodland along with a small sub-compartment that we have labelled hedgehog row2.
Because MyForest is aimed at woodland management it comes with lots of nice features for this purpose. I am especially fond of the mapping functionality which generates lovely geo-encoded pdf files that can be dragged and dropped into QGIS. Below is an example of this. Because both the PDF and map layer share the correct geospatial data, they are perfectly aligned with each other. Note the boundary line of the woodland and how it perfectly matches up along the west boundary.3
Mapping the shape of the woodland accurately using MyForest was a doddle. I used the transfer plan from the sale of the woodland which showed OS (ordinance survey for international readers) map features. I used their interface to draw the shape of the woodland out tracing over the same OS map matching the features from one to the other. I also used the area calculator to ensure that the size of the woodland matched. It took less than fifteen minutes.
There is a lot more to MyForest. I certainly intend on producing a lot of content around how how I use it to produce, submit and maintain a Forestry Commission compatible woodland management plan. The starting point for MyForest is to have your boundaries and your sub-compartments mapped out. I have the boundaries marked out, but not the sub-compartments or important features4. So how do you get the geospatial data for the sub-compartments?
Garbage in, Garbage Out
So how do you capture your mapping data I hear you ask? Well before you suggest a phone and proudly proclaimed the issue solved, think again. Consumer GPS is accurate to 2-5 metres under ideal conditions. In a woodland that has dubious signal then it is even less accurate. Below you can see the red dots which are GPS data points we captured from our iPhones when we purchased the woodland. Excuse the animated gif, but it serves a purpose.
The dots are far from the actual property boundaries, which for property surveying isn’t acceptable for our needs. Of course it could be operator error, or the fact that signal in the woodland is generally awful, but the iPhone generated data isn’t that useful beyond vaguely locating a point. However, as with all technology the garbage in, garbage out (GIGO) principal is at play. So to ensure that our sub-compartments and landmarks are in the right place I need accurate data. How do I get that?
I could go down the route of purchasing professional grade GPS equipment and a subscription to centimetre level precision. However that starts in the ranges of thousands of pounds for the gear and then you have the on-going subscription costs for the accurate GPS network. I could also invest in some of the newer fancy-pants RTK (real time kinetics) GPS gear that is lowering the cost of centimetre accurate GPS for the world. However that still puts me in the costs of hundreds for gear and requiring a subscription to the data services that power it.
I could also invest in a super fancy-pants drone and fly missions over the woodland using the above methods, but I lack the gold to do that just now. Whilst I am not ruling out any of these options in a future where my daily bread and butter is linked to generating accurate geospatial data, that day is not today.
Shame, I’d like a fancy-pants drone but that is not happening any time soon. However, I do have a nice map of our woodland in QGIS, so I wonder..
Adding a grid in QGIS
This was actually easier than I thought it would be. One of the QGIS menus (vector > research tools) has an option to create a grid. It is a case of some details and smashing the button.
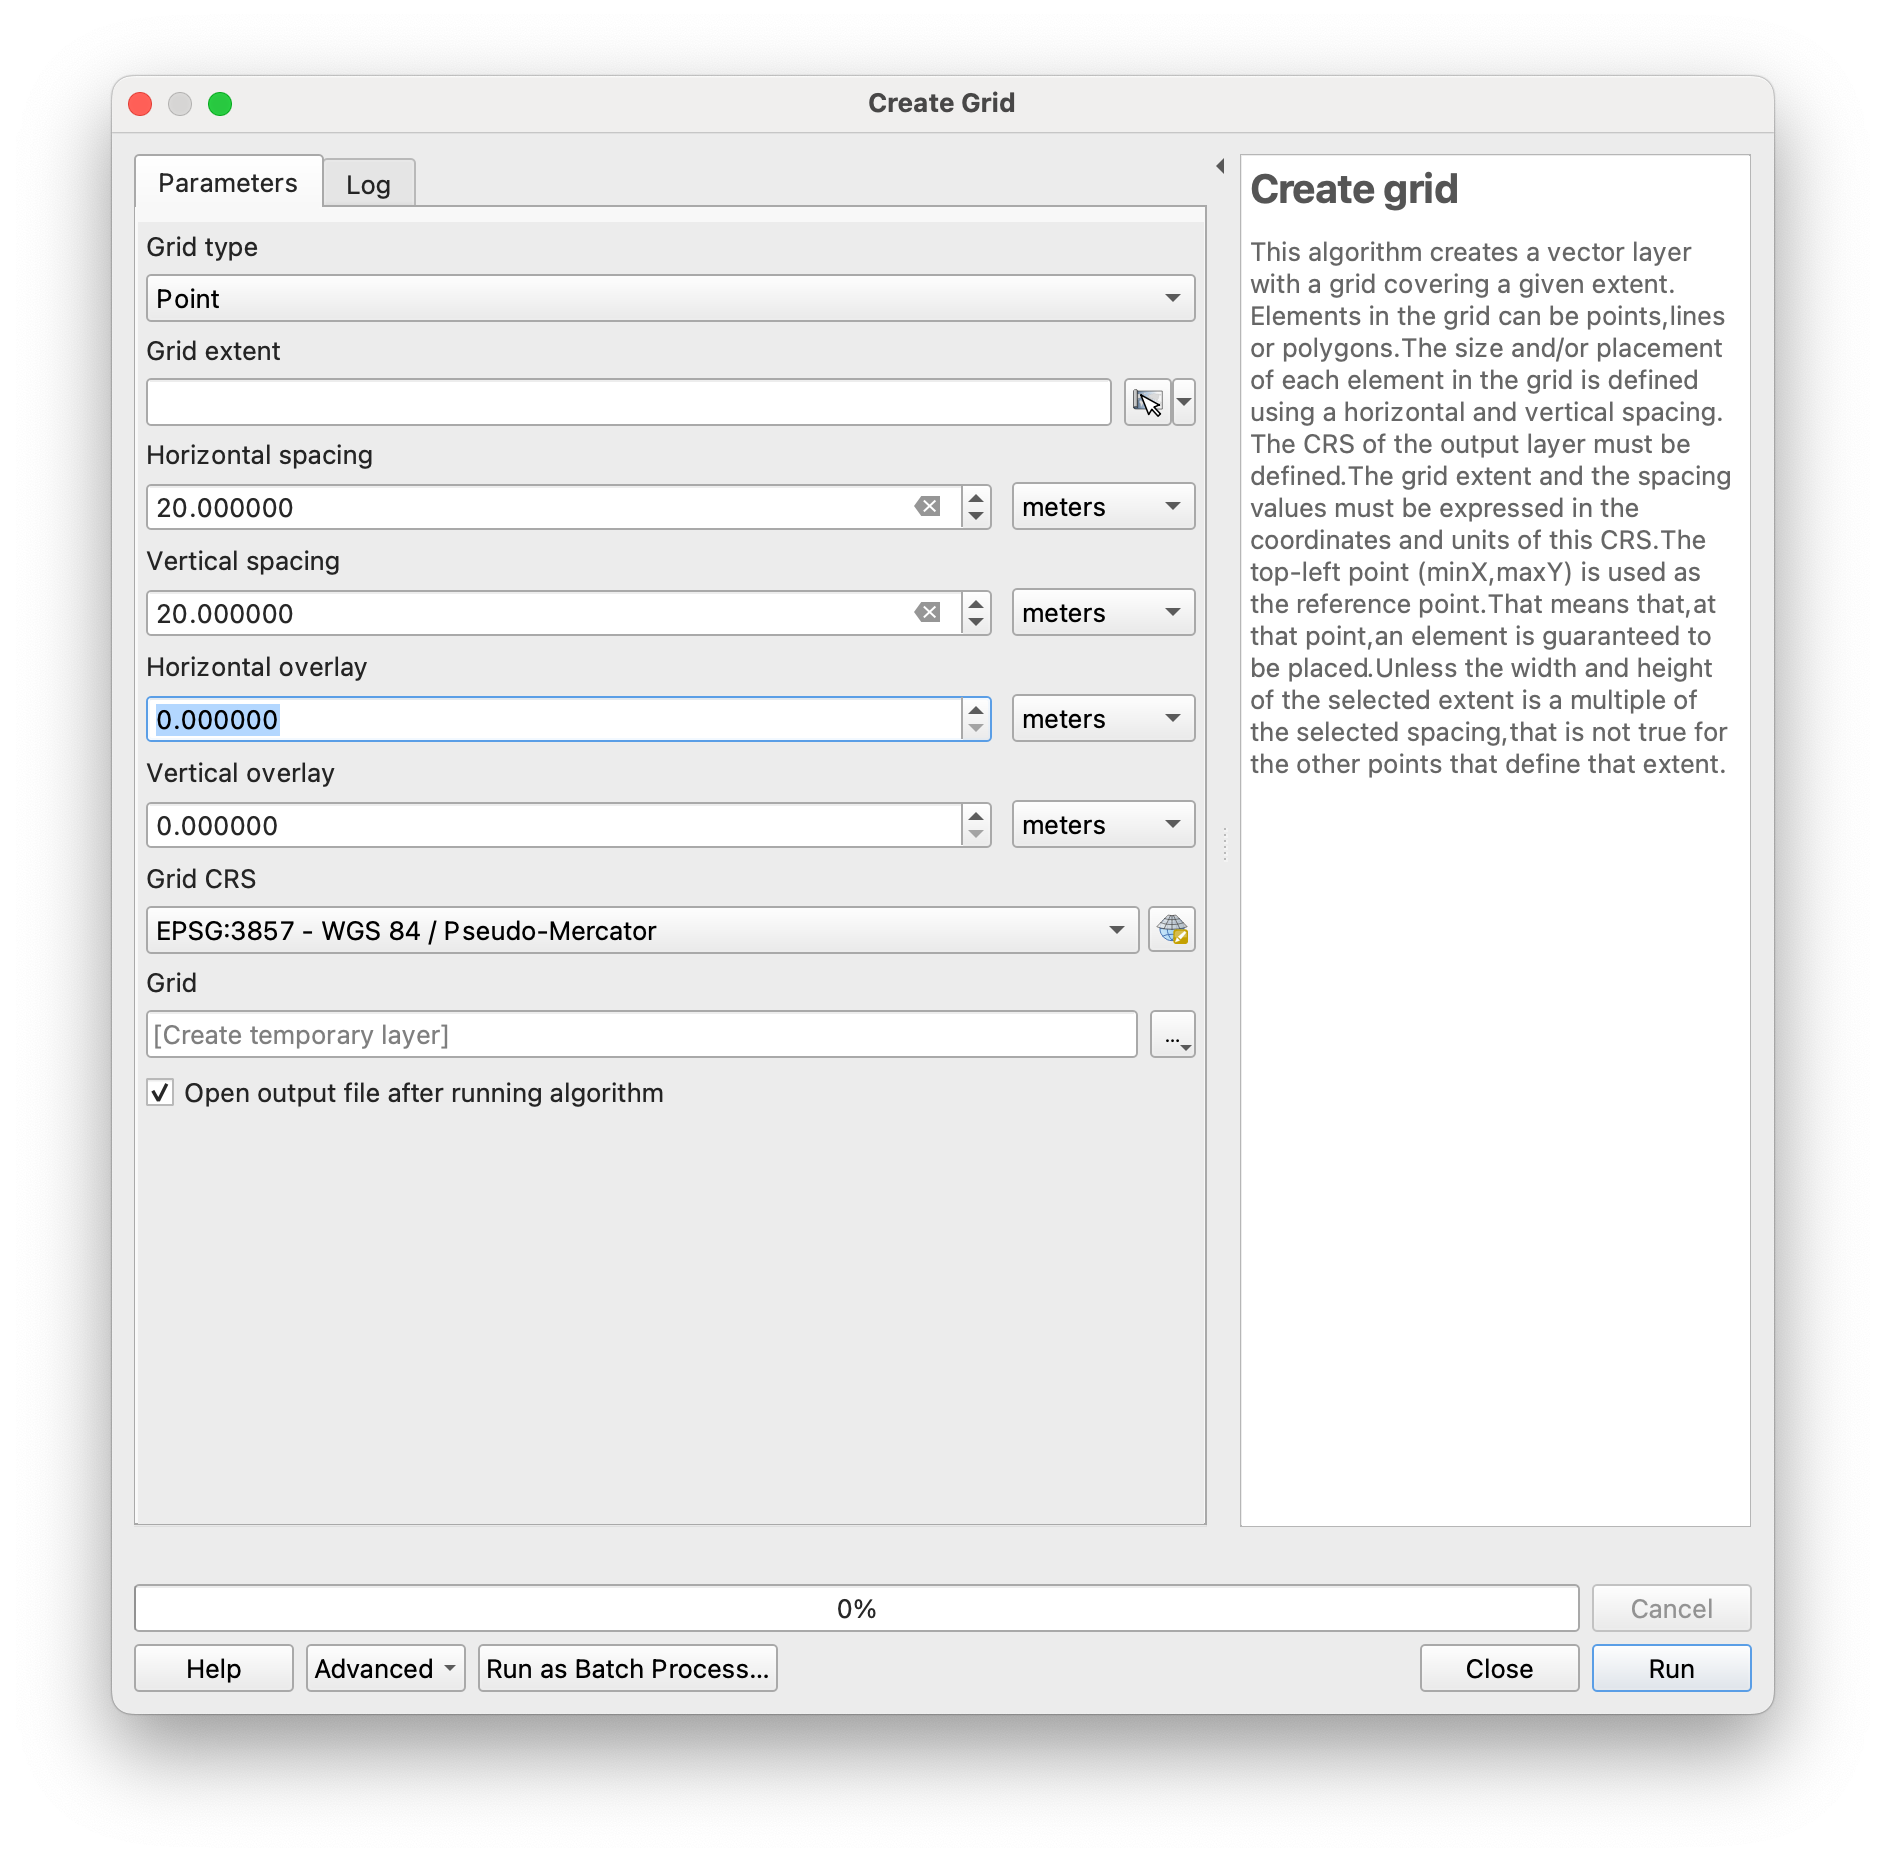
Once you run that function, it creates a grid overlay in which each of the grids are twenty metres by twenty metres.

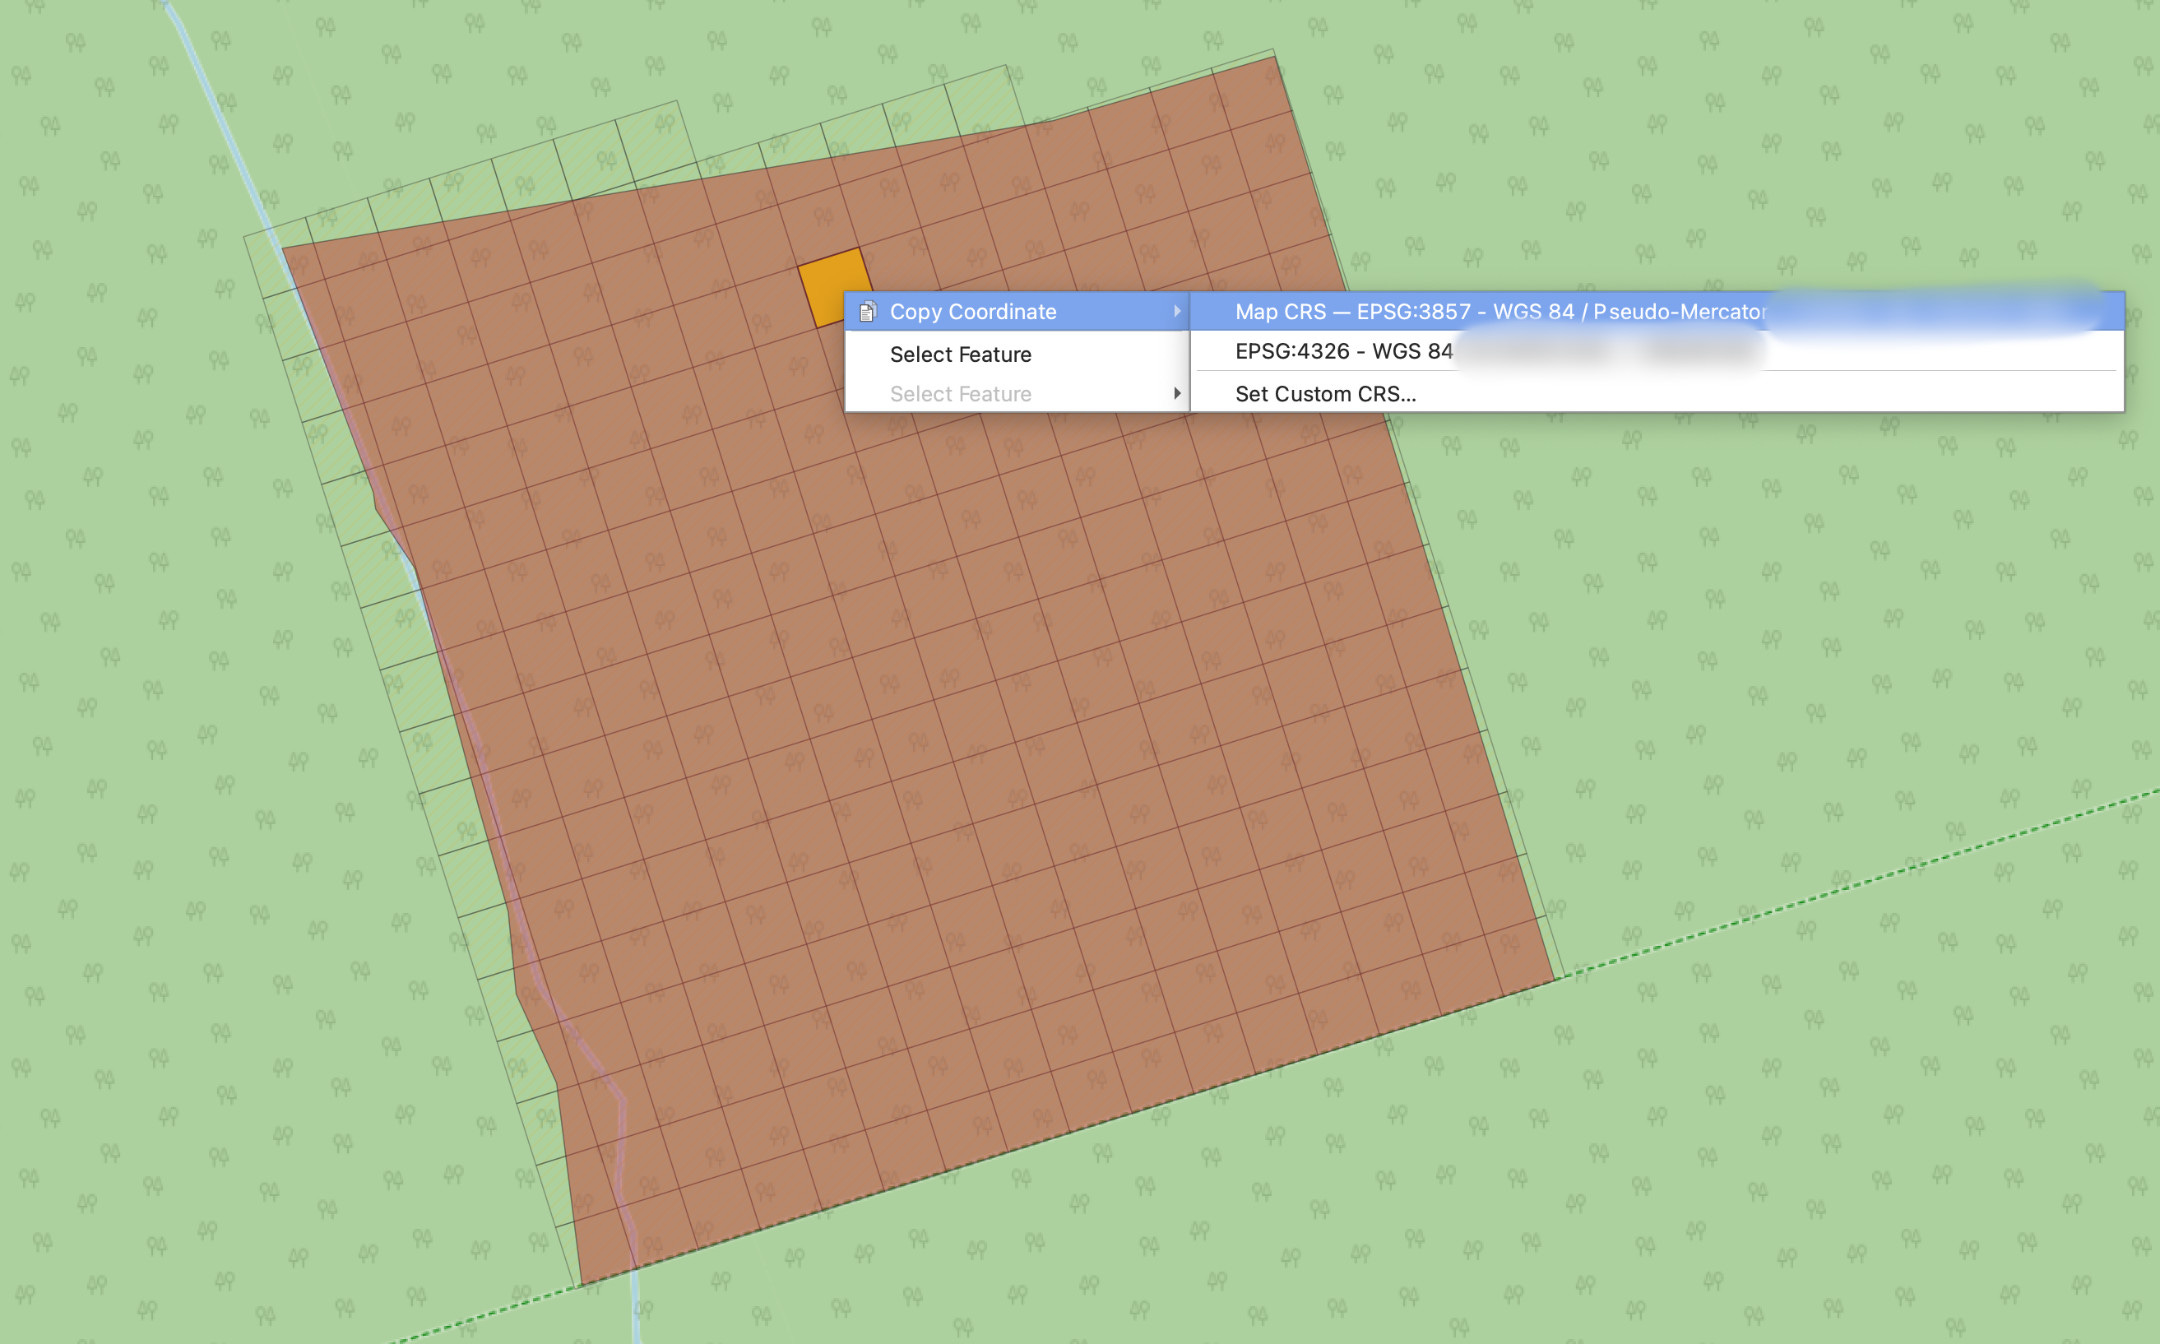
For the sake of precision, this isn’t actually a grid as far as QGIS is concerned. It is a series of polygons (we can see they are squares, but they are called polygons in GIS world) each of which has a precise fixed set of coordinates that map it to the surface of the earth. Once I had these polygons in place, it was simply a matter of rotating and moving all of the polygons so that they matched the boundaries of the woodland and then removing the polygons that were outside of the woodland boundary. Bingo, we have an accurate 20*20 grid of our woodland. You can see below that each section is also clickable and it gives the option to copy the coordinates which can be pasted into any mapping software such as Google Maps, Apple Maps etc.
I still have to figure out how to get that auto-labelled so that each grid has a reference, but this is already outstandingly helpful. However…
And this dear reader is where we come full circle from fancy-pants technology and back to sticks and string.
Tape measure, compass and stakes.
Whilst having the twenty by twenty grid is helpful from a mapping point of view, it isn’t all that helpful from a feature point of view. A map should show features and as it stands, I’d have no where of knowing where “three oak grove” is or where “the lightning tree was”.
So using the above grid as an absolute reference of sorts, I’ll be measuring out our sub-compartments and important points using nothing more than a twenty metre tape measure, a compass and some sticks. Technically this is still GIS, albeit a little more analogue.
For me, this is a manageable way to map the woodland as there is only 3.12 hectares and so using a scale of twenty metres is actually a nice granular level.
The general idea is that I’ll be whacking some stakes in the ground and using the compass to ensure they are correctly orientated. I know that each twenty metre area correlates to a specific grid in this map and so I can use this grid to draw out the sub-compartments and to precisely locate (precisely-ish. Ish is fine in this case) features.
Eventually, the woodland should be mapped. Keep your eyes peeled for a video of that process coming in the near future.
Conclusion
The fact that there isn’t just a purely technical solution vibes well with me. As much as I’d love to map the woodland by releasing a drone and having it do it’s thing, or by having the gear on hand to measure centimetre level coordinates I think I’d miss getting to know the woodland on an intimate level. Doing it by hand this time (maybe once it is all it will take to convince me never to do it manually again) will allow me to get to know all the nooks and crannies.
I’ll get a precise shape of the main sub-compartments along with precise relative measurements of the important veteran trees. I’ll even get a list and location of all the hazard trees that need to be dealt with.
I’ll probably lose some of you with the next paragraph but my next challenge is to figure out how to get QGIS to save all of my mapping data into a postgres database in such a way so that Djangos geospatial modelling can read it. If I can figure that out, then I have the life of treedom website hooked up to our woodland map. That would be aces.
Thanks for reading and if you have any questions, drop a comment :)
Which at the time of writing, I completely intend on renewing and paying for next year.
Not that we’ve seen any Hedgehogs in it. We just like the idea of it as it is covered in oak leaf litter and a Hedgehogs scuttling about the place would make it full metal A. A. Milne.
The North boundary does match up, but the aqua area from the PDF is the border of the ancient woodland whereas the layer in the background is the small area of non-ancient woodland. There’s about a 80m section of woodland that is not classed as semi-ancient for some reason.
I’ll go into what a sub-compartment is separately but for now just think of it as a “bit of the woodland”.
I think I understood the bit about the "twenty metre tape measure, a compass and some sticks."